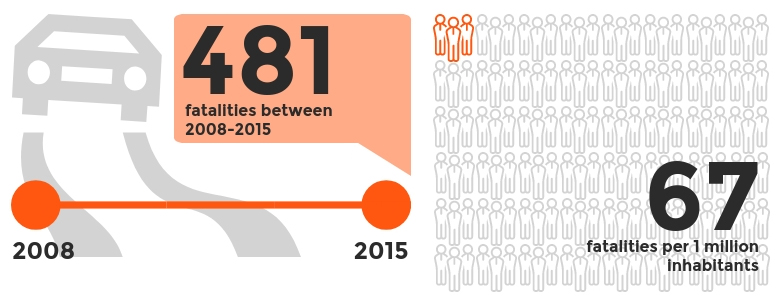
As part of our focus on Road Safety in Europe, we look at statistics for road safety in Cyprus. Our report looks at data from 2008 to 2015, where 481 fatalities were recorded on Cyprus’ roads. At 67 deaths per 1 million inhabitants, Cyprus has more road deaths per 1 million inhabitants than the EU average of 51. Sweden has the best safety record with just 27 deaths per 1 million inhabitants, whereas Bulgaria has the worst record with 99 deaths per 1 million inhabitants.
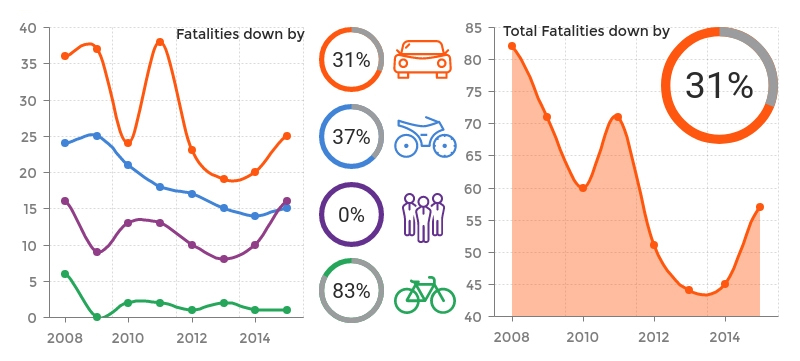
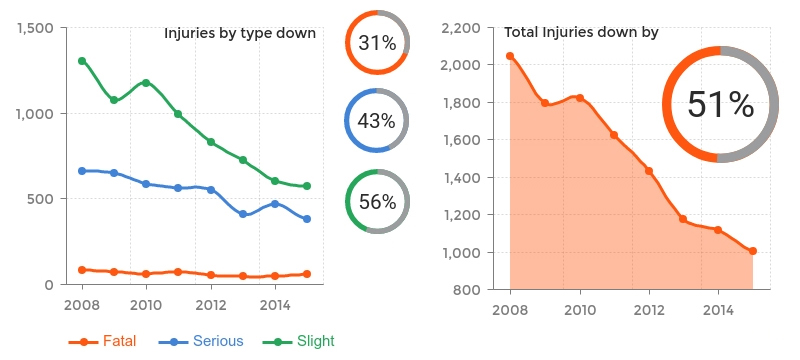
Overall fatalities have dropped 31% from 82 in 2008 to 57 in 2015, however 2013 and 2014 saw lows of 44 and 45 fatalities respectively, the lowest recorded. Unsurprisingly, the most fatalities occurred in cars with bicycle deaths the lowest of user types.
Fatalities by Road User
Road User
2008
2009
2010
2011
2012
2013
2014
2015
Car
36
37
24
38
23
19
20
25
Motorcycle
24
25
21
18
17
15
14
15
Pedestrians
16
9
13
13
10
8
10
16
Total
82
71
60
71
51
44
45
57
Total injuries dropped by 51% from 2008 to 2015 with just 1004 reported injuries from road traffic accidents throughout Cyprus, from a peak of 2045 in 2008. The biggest drop was in the 'slight' category, meaning fewer minor injuries were reported.
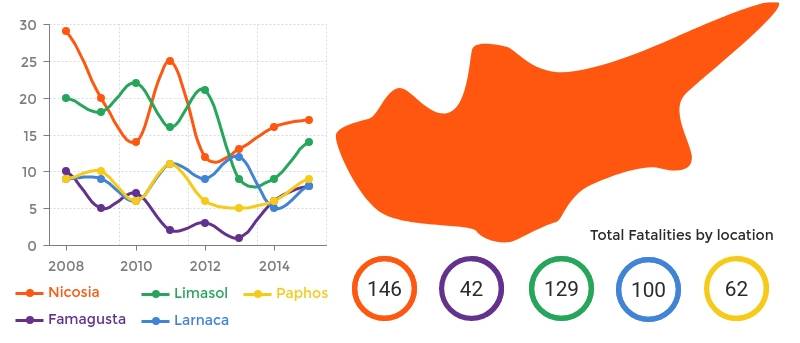
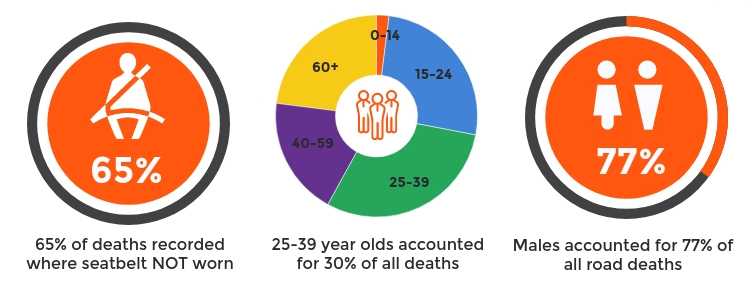
On average around 2/3 of fatalities occured when a seatbelt was not worn. Since 2008 the age groups most at risk of fatality in a road accident are 15-24 and 25-39, with males accounting for 77% of all fatalities. It's no surprise that Nicosia saw the highest gross fatalities due to volume of traffic and population of the capital, it did however see the biggest % drop from 2008 to 2015.
Paphos saw an average of 9 fatalities per year over the 8 year period.
Fatalities by Region
Region
2008
2009
2010
2011
2012
2013
2014
2015
Total
Nicosia
29
20
14
25
12
13
16
17
146
Famagusta
10
5
7
2
3
1
6
8
42
Limasol
20
18
22
16
21
9
9
14
129
Larnaca
9
9
6
11
9
12
5
8
69
Paphos
9
10
6
11
6
5
6
9
62
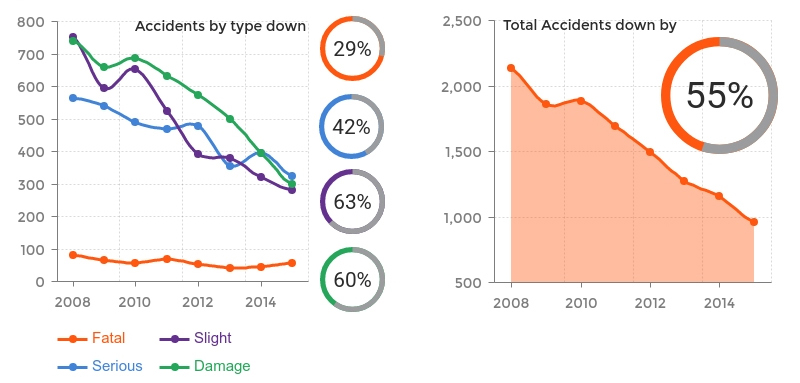
Overall accidents reduced by 55% from 2008 to 2015. Fatal accidents reduced by 29% to 56 in 2015, however 2013 was the year with lowest recorded fatalities of just 41. The biggest drop of accident type is 63% in the 'slight' damage category down from 750 to 280.
Road Addidents by Type
Accident Type
2008
2009
2010
2011
2012
2013
2014
2015
Total
Fatal
79
64
56
67
51
41
44
56
458
Serious
563
539
489
467
477
355
395
324
3609
Slight
750
594
652
524
391
378
319
280
3888
Damage
739
659
686
632
573
499
395
298
4481
Total
2131
1856
1883
1690
1492
1273
1153
958
12436
Road Accident Injury Type
Injury Type
2008
2009
2010
2011
2012
2013
2014
2015
Total
Fatal
82
71
60
71
51
44
45
57
481
Serious
661
647
586
561
551
407
467
377
4257
Slight
1302
1076
1176
992
830
722
603
570
7271
Total
2045
1794
1822
1624
1432
1173
1115
1004
12009
Fatalities with / without Seatbelt
Seat Belt Use
2008
2009
2010
2011
2012
2013
2014
2015
Total
With Seatbelt
13
14
7
10
5
8
6
11
74
Without Seatbelt
21
20
17
25
18
11
11
14
137
Fatalities by Age Group
Age
2008
2009
2010
2011
2012
2013
2014
2015
Total
15-24
22
21
14
15
11
18
14
12
127
25-39
21
24
22
24
17
6
11
17
142
40-59
21
7
11
16
13
7
7
9
91
60+
17
15
12
15
9
12
13
18
111
Total
82
71
60
71
50
44
45
57
480
Fatalities By Gender
Gender
2008
2009
2010
2011
2012
2013
2014
2015
Total
Male
65
59
50
58
37
35
32
36
372
Female
17
12
10
13
14
9
13
21
109
Total
82
71
60
71
51
44
45
57
481