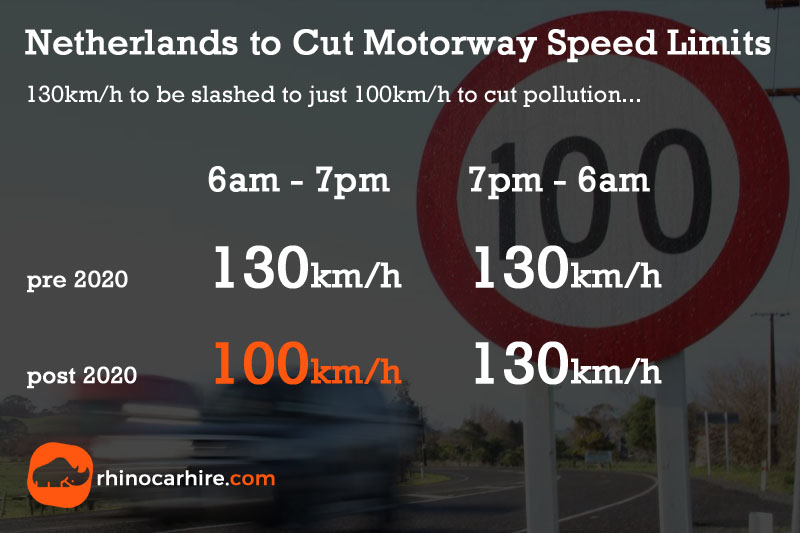
Reducing speed limits on motorways in the Netherlands was primarily aimed at reducing nitrogen emissions rather than greenhouse gas emissions like CO2, which are a primary concern for EU climate goals. Nitrogen emissions are particularly problematic in the Netherlands due to their impact on local air quality and biodiversity. Lowering the speed limits from 130 km/h to 100 km/h on daytime hours was part of a broader strategy to comply with EU air quality standards, specifically addressing nitrogen oxide (NOx) emissions.
In the European Union, the Netherlands is generally not considered among the countries with the lowest speed limits overall. The Netherlands has moderate speed limits compared to some other EU countries like Andorra, Malta and Cyprus.
Determining the country with the absolute slowest speed limits in Europe can vary based on different factors such as road types (urban vs. rural), specific regulations, and temporary speed restrictions. Generally, some countries are known for lower speed limits on specific road types compared to others. For instance:
-
Andorra: This small principality located between Spain and France has relatively low speed limits on its mountainous roads, often ranging from 50 km/h (31 mph) in urban areas to 90 km/h (56 mph) on rural roads.
-
Malta: As a densely populated island nation, Malta has generally lower speed limits compared to mainland Europe, with urban limits around 50 km/h (31 mph) and rural limits at 80 km/h (50 mph).
-
Cyprus: Speed limits in Cyprus are generally lower than in many other European countries, with urban areas typically having limits of 50 km/h (31 mph) and rural roads set at 80 km/h (50 mph).

The slowest speed limit in Europe?
Not quite, the Netherlands will join Cyprus as the EU’s slowest driving nations with maximum speed limits (although only applicable during between 6am and 7pm) of just 100km/h, although Cyprus has far fewer motorways and much less congestion. When we look at the top 10 EU countries by population, the Netherlands is set to become the nation with the slowest speed limit, while Poland remains the fastest at 140km/h.
Rank
Country
Population (million)
Speed Limit (km/h)
* Some sections of Autobahn in Germany have no speed restriction
** Netherlands currently 130km/h, 100km/h limit due in 2020.
When did the Netherlands cut motorway speed limits?
The Netherlands did adjust speed limits in 2020 as part of ongoing efforts to manage traffic flow, improve safety, and reduce emissions. One notable change was the reduction of daytime speed limits on many Dutch highways from 130 km/h (about 81 mph) to 100 km/h (about 62 mph) in an effort to curb nitrogen emissions. This adjustment was part of broader environmental policies aimed at meeting European Union air quality standards. Additionally, speed limits in certain urban areas and on regional roads may have also been adjusted as part of local traffic management strategies.If
renting a car in the Netherlands, getting a
speeding ticket in a rental car will result in the fine being passed to you from the rental agent, plus an administration fee.
Will cutting speed limits reduce emissions?
Generally speaking, the faster you drive the less efficient it becomes, using more fuel and increasing emissions. The primary factor is air resistance, the amount of work required by the engine to push the car through the air increases exponentially with speed, requiring more effort (fuel). A reduction in maximum speed is also claimed to reduce congestion which will also lead to a reduction in emissions. Whilst it’s difficult to put an exact figure on how reducing the speed limit from 130 to 100 km/h will reduce emissions, the European Environment Agency (EEA) published a report in 2011 suggesting that cutting speed limits from 120-110km/h for Euro 4-compliant petrol and diesel models could see a reduction of 18% and 12% respectively, so a cut in speed from 130km/h to just 100km/h is likely to see even greater reductions, up to as much as 30%.
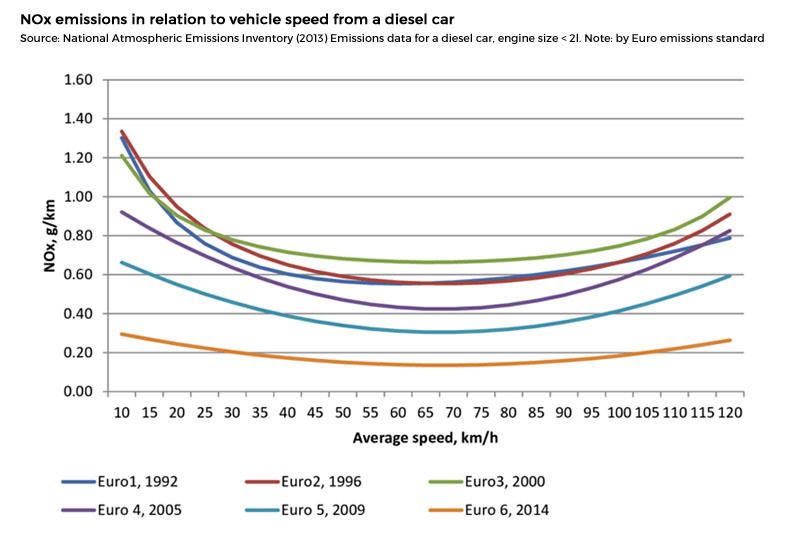
Figures are hotly disputed as the EEA conceded that its figures were based on an assumption of smooth driving and not necessarily real-world driving, however its data was based on a 10km/h reduction in speed rather than the 30km/h reduction the Netherland will experience. The graph below shows the effect of speed on NOx emissions.

Source: Smithers, Richard & Harris, Rachel & Hitchcock, Guy. (2016). The ecological effects of air pollution from road transport: an updated review.