We reveal the most dangerous roads by deaths on the roads in 2016 v 2013 by total number and by population
A title that no country wants, however when driving in a different country it’s useful to know how dangerous the roads are. Our Drive Smart guides offer lots of useful driving information to help keep you safe on the roads. Here we look at the most dangerous roads in the world from total number of deaths on the road to deaths per 100,000 by population to give a fairer assessment of relatively how dangerous driving is in any given country. For example, more people die on the roads in the
USA than almost any other country in the world, only India, China and
Brazil have higher road fatality rates, however due to the population of the USA it’s actually a relatively low death per 100,000 population of just 12.4 deaths in 2016. Compared to some of the safest roads in Europe however with death rates of less than 3 people per 100,000 of the population, driving in the USA is still relatively dangerous.
Most Dangerous Roads by Country
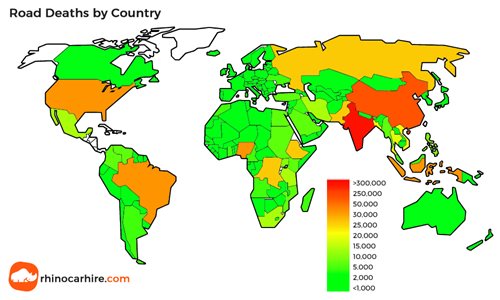
India tops the list with near 300,000 deaths on the roads in 2016, up 44% compared to 2013. That’s a staggering 92,000 more people killed on the roads since 2013. One of the main reasons for this huge number however is simply due to India having one of the largest populations of any country on the planet which is part of the reason for the high figure. A fast growing economy has also lead to a significant increase in the number of cars on the roads in India, further increasing reported death rates. When we look at number of deaths on the roads per 100,000 of the population however, India fares much better with around the global average of deaths per 100,000 at 22.6, far from the worst, which is 35.9 in Liberia.
China has the second most road deaths in the world with a little over a quarter of a million people losing their lives on the roads in 2016. Unlike India however, China is showing a negative trend since 2013 with a 2% drop. An emerging economy also, however china has invested massively in its infrastructure including its road network which has reduced the number of deaths on the roads in China, despite the number of road users still growing rapidly. When you compare China to the rest of the world in terms of deaths per 100,000 population, it sits below the average at 18.2 deaths per 100,000. It has a long way to go to equal the safest roads in the world in countries like the
UK,
Australia and much of western Europe and Scandinavia. Brazil is a distant 3rd with 41,000 roads deaths reported in 2016, a 13% reduction from near 47,000 in 2013.
Highest Road Deaths by Total Volume by Country - 2016
Country
Population (million)
Income*
Road Deaths 2013
Road Deaths 2016
% Change
India
1324.2
Middle
207,551
299,091
44%
China
1411.4
Middle
261,367
256,180
-2%
Brazil
207.7
Middle
46,935
41,007
-13%
USA
322.2
High
34,064
39,888
17%
Nigeria
186
Middle
35,641
39,802
12%
Indonesia
261.1
Middle
38,279
31,726
-17%
Pakistan
193.2
Middle
25,781
27,582
7%
Ethiopia
102.4
Low
23,837
27,326
15%
DR Congo
78.7
Low
22,419
26,529
18%
Russia
144
Middle
27,025
25,969
-4%
Viet Nam
94.6
Middle
22,419
24,970
11%
Bangladesh
163
Middle
21,316
24,954
17%
Thailand
68.9
Middle
24,237
22,491
-7%
Mexico
127.5
Middle
15,062
16,725
11%
Iran
80.3
Middle
24,896
16,426
-34%
Tanzania
55.6
Low
16,211
16,252
0%
South Africa
56
Middle
13,273
14,507
9%
Kenya
48.5
Middle
12,891
13,463
4%
Philippines
103.3
Middle
10,379
12,690
22%
Uganda
41.5
Low
10,280
12,036
17%
Myanmar
52.9
Middle
10,809
10,540
-2%
Sudan
39.6
Middle
9,221
10,178
10%
Turkey
79.5
Middle
6,687
9,782
46%
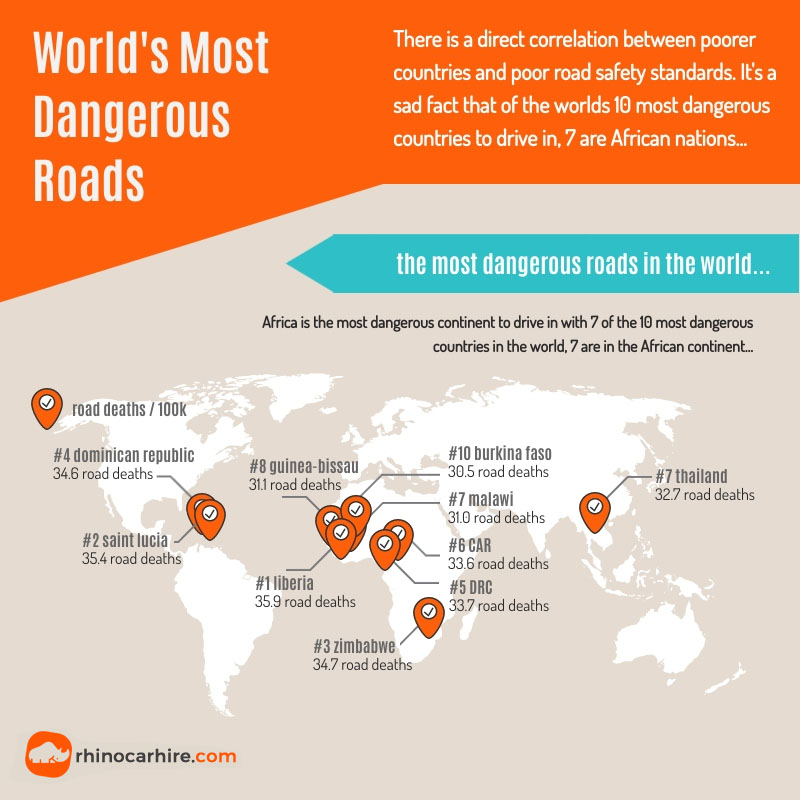
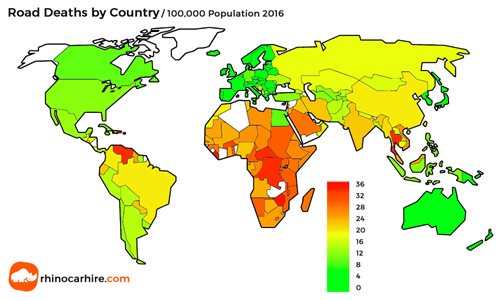
Most Dangerous Roads by Population
A more representative figure to assess the relative safety of a countries roads is to use the number of road deaths per 100,000 population. Whilst there are many factors that influence this (% of population that drive / use the roads), it’s a better indication of how dangerous the roads are in a given country. Whilst India an China undoubtedly have the highest number of total deaths on the road, neither feature in the most dangerous roads by population. Here you’ll find Liberia top the table with 35.9 deaths per 100,000, closely followed by Saint Lucia (although its low population casts doubt on this figure). 8 of the 10 countries with the worst road deaths by population are African nations, further supporting the data to suggest that the poorest countries have the worlds worst road safety records.
Highest Road Deaths by Population by Country - 2016
Country
Population (million)
Income*
Road Deaths 2013 per 100k population
Road Deaths 2016 per 100k population
% Change
Liberia
4.6
Low
31.4
35.9
14%
Saint Lucia
0.2
Middle
18.5
35.4
91%
Zimbabwe
16.2
Low
24.7
34.7
40%
Dominican Republic
10.6
Middle
28.7
34.6
21%
DR Congo
78.7
Low
28.5
33.7
18%
Central African Republic
4.6
Low
32.5
33.6
3%
Thailand
68.9
Middle
35.2
32.7
-7%
Guinea-Bissau
1.8
Low
25.8
31.1
21%
Malawi
18.1
Low
31.7
31
-2%
Burkina Faso
18.6
Low
27.2
30.5
12%
Namibia
2.5
Middle
22.2
30.4
37%
Mozambique
28.8
Low
28.3
30.1
6%
Cameroon
23.4
Middle
26.2
30.1
15%
Rwanda
11.9
Low
31.7
29.7
-6%
Gambia
2
Low
26.7
29.7
11%
Tanzania
55.6
Low
29.2
29.2
0%
Togo
7.6
Low
27.9
29.2
5%
Uganda
41.5
Low
24.8
29
17%
Lesotho
2.2
Middle
26.5
28.9
9%
Saudi Arabia
32.3
High
24.5
28.8
18%
Madagascar
24.9
Low
26.1
28.6
10%
Belize
0.4
Middle
22.1
28.3
28%
Least Improved Road Death Record by Country
Whilst road safety is generally improving, some countries have reported significant rises in road deaths from 2013 to 2016 with Tonga the worst offender seeing a 124% increase in deaths per 100,000 population, up from 7.5 to 16.8. Unsurprisingly, the worst offenders on paper are countries with very low populations, meaning the figures can be easily swayed by a relatively small number of reported incidents. Saint Lucia and the Sychelles have reported near double the number of road deaths from 2013 to 2016. The most worrying statistic here is the
UAE with a population of 9.3 million, it has witnessed an increase in road deaths from 11 to 18.2 (per 100,000 population) in that same period. For a country with a very high income level, such an increase in road deaths is cause for concern.
Country
Population (million)
Income*
Road Deaths 2013 per 100k population
Road Deaths 2016 per 100k population
% Change
Tonga
0.1
Middle
7.5
16.8
124%
Saint Lucia
0.2
Middle
18.5
35.4
91%
Seychelles
0.1
High
8.5
15.9
87%
Kiribati
0.1
Middle
2.6
4.4
69%
Fiji
0.9
Middle
5.7
9.6
68%
Panama
4
Middle
9.6
14.3
49%
Iceland
0.3
High
4.5
6.6
47%
Turkey
79.5
Middle
8.4
12.3
46%
Somalia
14.3
Low
18.6
27.1
46%
India
1324.2
Middle
15.7
22.6
44%
Zimbabwe
16.2
Low
24.7
34.7
40%
Guyana
0.8
Middle
17.8
24.6
38%
Namibia
2.5
Middle
22.2
30.4
37%
New Zealand
4.7
High
5.8
7.8
34%
Antigua and Barbuda
0.1
High
5.9
7.9
34%
Chad
14.5
Low
21.4
27.6
29%
Belize
0.4
Middle
22.1
28.3
28%
Israel
8.2
High
3.4
4.2
24%
Philippines
103.3
Middle
10
12.3
23%
Jamaica
2.9
Middle
11.1
13.6
23%
Bhutan
0.8
Middle
14.3
17.4
22%
Bulgaria
7.1
Middle
8.4
10.2
21%
Do Poor Countries Have More Dangerous Roads?
Sadly there does appear to be a direct correlation between the income level of a country and its road safety record. Lack of investment in infrastructure and older vehicles is a likely driving force to higher road deaths in poorer countries. Of the 20 countries with the worst road safety record, 13 fall into the low income bracket and 6 in the middle income bracket. Only
Saudi Arabia feature in this list as a high income nation and the majority of the countries with the most recorded road deaths are in Africa.
See all Road Death Data;
Page Number :
Page Size :